3 Hidden Data Patterns Every D2C Brand Should Track: Discounts, Assortment & Buying Behavior
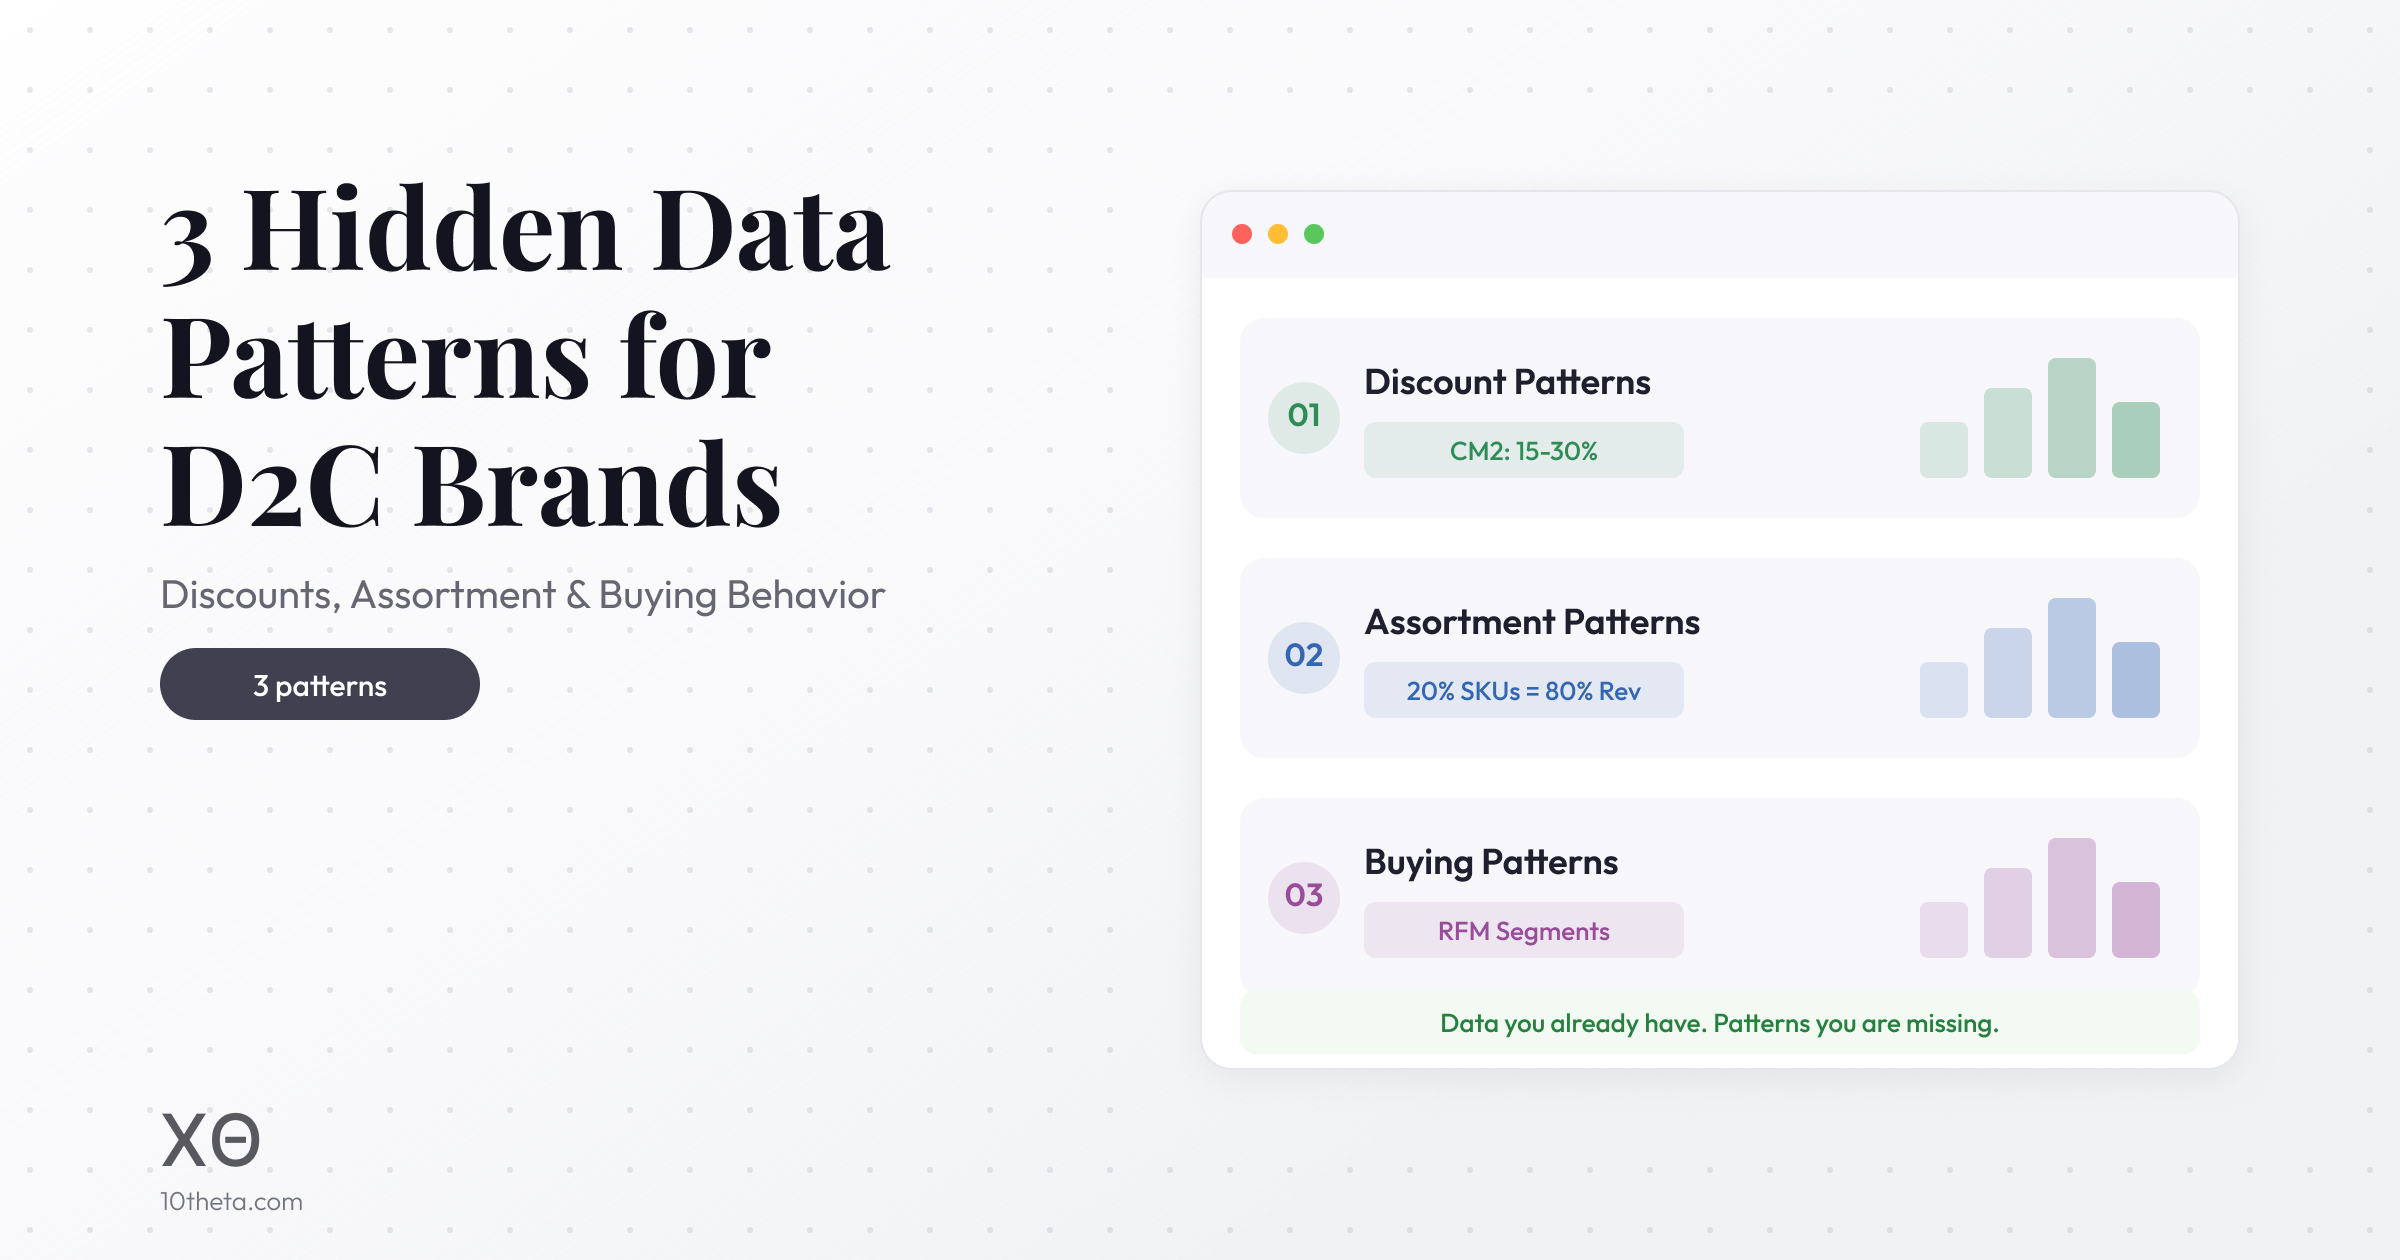
Most D2C brands track vanity metrics - website traffic, Instagram followers, total GMV. The ones that actually scale profitably track three hidden data patterns that sit underneath these numbers: discount patterns, product assortment patterns, and buying behavior patterns.
These are not exotic analytics concepts. They are basic data patterns that every D2C brand generates from day one but almost nobody analyzes systematically. A brand doing ₹50 lakh monthly GMV already has enough data to extract actionable insights from all three. The problem is not data availability. The problem is knowing what to look for.
1. Discount Patterns: Set a CM2 Floor Before You Discount
The single most common mistake Indian D2C brands make is discounting without a profitability floor. Festive sale? 40% off. Customer acquisition campaign? Flat 30%. New product launch? Buy one get one. The discounts feel like they are driving growth, but without tracking the impact on contribution margin, they often destroy profitability.
CM2 (Contribution Margin 2) is the metric that separates sustainable discounting from self-destruction. CM2 deducts all variable costs from revenue - COGS, shipping, payment gateway fees, returns processing, and marketing spend. What remains is the actual profit per order.
CM2 benchmarks for Indian D2C
- Above 15%: Excellent. You can invest aggressively in growth.
- 10-15%: Healthy. Sustainable at current scale.
- 5-10%: Tight. One bad return rate spike could push you negative.
- Below 5%: Critical. You are likely losing money on a significant portion of orders.
The backward discount calculation
Instead of deciding discounts based on what competitors offer or what "feels right," work backward from your CM2 floor:
- Set your minimum acceptable CM2 (for most brands, 10-15% of AOV)
- Calculate your variable costs per order: COGS + shipping + gateway fees + estimated return cost + marketing attribution
- The gap between your selling price and (variable costs + minimum CM2) is your maximum discount
Here is a real example. A skincare brand sells a serum at ₹999 MRP:
- COGS: ₹200
- Shipping: ₹65
- Payment gateway (2%): ₹20
- Returns (15% rate, ₹130 avg cost): ₹20
- Marketing/CAC: ₹150
- Total variable cost: ₹455
- Minimum CM2 at 12%: ₹120
- Maximum discount: ₹999 - ₹455 - ₹120 = ₹424 (42%)
This brand can offer up to 42% off and still maintain a healthy CM2. But if they blindly match a competitor's 50% discount, they are losing ₹76 on every order. Multiply that by 1,000 orders during a sale campaign, and that is ₹76,000 in losses disguised as "growth."
Discount patterns to track
- CM2 by discount tier: What is your actual CM2 at 10%, 20%, 30%, 40% discount levels? Many brands discover their 30%+ discount orders are CM2-negative.
- Discount-to-repeat-purchase correlation: Do heavily discounted customers come back at full price? Or do they only buy during sales? If 80% of discount buyers never return at full price, your discount is not acquiring customers - it is renting them.
- Channel-wise discount efficiency: The same 20% discount may generate positive CM2 from organic customers (who would have bought anyway) but negative CM2 from paid acquisition (where you are stacking CAC on top of the discount).
2. Product Assortment Patterns: Which Products Drive Profitable Growth
Your product catalog is not a flat list. It has a hidden structure - entry products that bring new customers, hero products that drive revenue, companion products that increase AOV, and long-tail SKUs that occupy warehouse space without contributing to growth.
The Pareto principle applies strongly: 20% of your SKUs typically drive 80% of your revenue. But the real insight is not in the 80/20 split itself. It is in understanding the role each product plays in the customer journey.
The four product roles
Entry products are what new customers buy first. They are usually lower-priced, lower-risk items that let customers try your brand without a big commitment. A fashion brand's entry product might be a ₹499 t-shirt. A skincare brand's might be a ₹299 face wash. Identifying your entry products tells you where to focus acquisition spend.
Hero products are your top revenue drivers. They have the highest sales volume and usually the best margins. Protect these ruthlessly - stock them deeply, never let them go out of stock, and resist the urge to discount them heavily. Your hero products should fund the growth of everything else.
Companion products are items that customers frequently buy alongside hero products. This is where assortment analytics becomes powerful. If 60% of customers who buy your ₹1,299 moisturizer also buy the ₹599 sunscreen within 30 days, that is a natural bundle. Creating a ₹1,699 bundle (10% off) increases AOV while giving the customer a deal on something they would have bought separately anyway.
Long-tail SKUs are products with low sales volume and low repeat purchase rates. They occupy warehouse space, tie up working capital, and complicate operations. The data often reveals that 30-40% of SKUs contribute less than 5% of revenue. Consider discontinuing or consolidating these.
Assortment patterns to track
- Market basket analysis: Which products are bought together? This reveals natural bundle opportunities and cross-sell recommendations.
- Product sequence analysis: What does a customer buy first, second, and third? This reveals the natural product journey and where customers drop off.
- SKU-level profitability: Revenue is vanity. What is the CM2 of each product? Some high-revenue products may be CM2-negative after returns and shipping are factored in.
- New product cannibalization: When you launch a new product, does it grow the pie or just steal sales from an existing SKU?
3. Buying Behavior Patterns: Predict What Customers Will Do Next
Every customer leaves a trail of behavioral signals - what they browse, what they add to cart, how long they take between visits, what payment method they choose, whether they open your emails. Individually, these signals are noise. In aggregate, they reveal predictable patterns that let you act before the customer does.
Repeat purchase timing
Every product category has a natural repurchishment cycle. A protein powder lasts 30 days. A face wash lasts 45 days. A pair of sneakers lasts 6 months. If you track the average gap between repeat purchases by product category and customer segment, you can trigger replenishment reminders at exactly the right moment - not too early (annoying) and not too late (they have already bought from someone else).
Brands that automate replenishment reminders based on actual purchase timing data see 15-25% higher repeat purchase rates compared to generic monthly email blasts.
Cart composition evolution
How a customer's cart changes over time tells you about their relationship with your brand. A new customer might buy a single entry product. By their third order, they are adding companion products. By their fifth order, they are buying premium products or gift sets. This progression - from trial to trust to loyalty - is predictable and can be accelerated.
If a customer's cart composition stagnates (they keep buying the same single product), they are at risk of churning. If their basket expands into new categories, they are becoming a high-LTV customer. Track basket diversity as a leading indicator of customer health.
RFM segmentation
RFM (Recency, Frequency, Monetary) analysis segments your customers into actionable groups based on their purchase behavior:
- Champions (recent, frequent, high value): Your best customers. Reward them, don't discount to them.
- Loyal Customers (frequent, high value, but not recent): They may be cooling off. Re-engage with new product launches or exclusive access.
- At Risk (were frequent and high value, but haven't bought recently): Urgently need a win-back campaign. WhatsApp or voice bot outreach works better than email here.
- New Customers (recent, low frequency): Need nurturing. Send product education, not discounts.
- Lost (not recent, not frequent): Either move to low-cost reactivation (email only) or stop spending on them entirely.
Churn prediction signals
AI churn models combine multiple behavioral signals to score each customer's likelihood of churning before it happens. The most predictive signals for Indian D2C brands:
- Delivery experience: Customers who had a delayed delivery or a return are 3x more likely to churn than those with smooth deliveries.
- Email/WhatsApp engagement drop: If a customer who used to open 60% of your messages drops to 10%, they are disengaging.
- Purchase gap elongation: If their average gap between orders goes from 30 days to 60 days, they are drifting.
- Support ticket history: Unresolved complaints are the strongest churn predictor. A customer who complained and got no resolution has a 65% chance of never buying again.
4. The Four Data Sources That Power These Patterns
These three patterns do not emerge from a single dashboard or report. They emerge from connecting four real-time data sources that every D2C brand already generates but rarely analyzes together:
Customers
Demographics, acquisition channel, browsing history, communication preferences, support interactions, lifetime value trajectory. This is the "who" layer. A first-time buyer from a Facebook ad behaves fundamentally differently from a returning customer who came through organic search. Analyzing customer data reveals which segments respond to discounts (and which ones don't need them), which customer types buy which product combinations, and where churn risk concentrates.
Orders
Transaction history, payment methods, discount codes used, shipping costs, return rates, delivery timelines, COD vs prepaid split. This is the "what happened" layer. Order data is where CM2 calculations live. It tells you which discount tiers destroy margin, which product bundles generate the highest per-order profit, and which pin codes have the highest RTO rates. Every order is a data point that sharpens your pricing and discount strategy.
Events (Web + Mobile)
Page views, product views, add-to-cart actions, checkout initiations, search queries, filter usage, session duration, scroll depth, email opens, WhatsApp interactions. This is the "intent" layer. Events capture what customers want before they buy (or don't). A customer who views a product page 4 times without buying signals price sensitivity. A customer who searches for "gift set" signals an upsell opportunity. Event data turns browsing behavior into demand signals that inform assortment, pricing, and launch timing.
Product Catalog
SKU attributes, pricing tiers, margin structure, inventory levels, category hierarchy, seasonal tags, variant data (size, color, material). This is the "supply" layer. Catalog data determines what is possible. When combined with order and event data, it reveals which products are underpriced (high demand, fast sellthrough), which are overpriced (high page views, low conversion), and which new product categories have demand signals but no supply.
5. From Data to Decisions: Observation, Insight, Execution
Raw data is worthless without a framework that converts it into action. The most effective D2C brands follow a three-step loop for every pattern they discover:
Step 1: Observation (What the data says)
This is the factual, numerical layer. No interpretation, just what happened. Examples:
- "Orders with 30%+ discount have a CM2 of -2.3%"
- "SKU #247 (lavender body lotion) is bought alongside SKU #112 (body wash) in 58% of orders"
- "Customers acquired in January have a 45-day average gap between order 1 and order 2, but it extends to 72 days between order 2 and order 3"
- "Product page views for 'gift sets' spiked 340% in the last 2 weeks but we have no gift set SKU"
Step 2: Insight (What it could mean)
This is the interpretation layer. Context turns observations into meaning:
- "Our 30%+ discounts are subsidizing unprofitable growth. We are acquiring customers who cost more than they generate." Impact: Discount strategy
- "Lavender lotion and body wash are natural companions. Customers already buy them together, but we are not making it easy." Impact: Ideal assortment
- "The elongating purchase gap after order 2 suggests customers try a second product but don't find enough reason to come back a third time. Our category depth may be too shallow." Impact: Product launches
- "There is latent demand for gift sets that we are not capturing. Competitors may be absorbing this demand." Impact: Demand forecasting
Step 3: Execution (What to do next)
This is the action layer. Every insight should produce a specific, time-bound action:
- "Cap maximum discount at 25% across all channels. Set CM2 floor at 12%. Review in 30 days." Ideal discount
- "Create a Lavender Duo bundle (lotion + body wash) at ₹899 (8% off buying separately). Place it on the body wash product page as primary cross-sell." Ideal assortment
- "Launch 3 new SKUs in adjacent categories (hand cream, pillow mist, candle) to give order-2 customers a reason for order 3. Target launch in 6 weeks." New launches
- "Build a gift set page with 3 pre-made bundles within 2 weeks. Run a targeted WhatsApp campaign to customers who viewed 'gift' search results." Pricing + Demand
This loop - Observation, Insight, Execution - runs continuously. Every week, new data generates new observations. Every observation is evaluated for insights. Every insight that clears the impact threshold gets an execution step. The brands that run this loop weekly grow 2-3x faster than those who check their data quarterly.
6. How to Start: The 30-Day Data Pattern Sprint
You don't need a data science team or expensive analytics tools to start extracting these patterns. Here is a practical 30-day plan:
Week 1: Discount audit
Pull your last 90 days of orders. Calculate CM2 for each order. Group by discount tier (0%, 1-10%, 11-20%, 21-30%, 31%+). You will likely discover that orders above a certain discount threshold are CM2-negative. Set your CM2 floor and communicate it to your marketing team.
Week 2: Product role mapping
Export your product catalog with units sold, revenue, and margin for the last 6 months. Classify each SKU as Entry, Hero, Companion, or Long-tail. Run a basic market basket analysis (even a spreadsheet pivot table works) to find which products are bought together.
Week 3: RFM segmentation
Export your customer list with last purchase date, total orders, and total spend. Score each customer on Recency (1-5), Frequency (1-5), and Monetary (1-5). Segment into Champions, Loyal, At Risk, New, and Lost. You will find that a small percentage of customers drive a disproportionate share of revenue.
Week 4: Action plan
Based on what you found, pick the three highest-impact actions: one discount policy change, one product bundle or assortment decision, and one customer re-engagement campaign. Implement all three and measure the impact over the next 30 days.
7. How xθ Insightθ Surfaces These Patterns Automatically
Insightθ connects all four data sources - customers, orders, events, and product catalog - in real-time and runs the Observation-Insight-Execution loop automatically. Instead of spending weeks building pivot tables, you get a live dashboard that surfaces observations ("CM2 dropped below 8% on orders with 30%+ discounts"), generates insights ("Your festive campaign is acquiring unprofitable customers"), and recommends execution steps ("Cap discount at 22% and shift budget to WhatsApp retargeting of existing customers").
The platform continuously analyzes every new order, every product page view, every cart event, and every customer interaction to update its pattern models. CM2 analysis runs on every order in real-time. Market basket analysis refreshes daily as new purchase combinations emerge. RFM segments update automatically as customers move between groups. Demand signals from event data surface emerging trends before they become obvious in revenue reports.
Combined with Cartθ for smart bundling at checkout and Identityθ for unified customer profiles, these data patterns translate directly into better discount decisions, optimized assortment, smarter pricing, accurate demand forecasting, and data-informed product launches.
What is CM2 in D2C and why does it matter for discount strategy?
CM2 (Contribution Margin 2) is the profit remaining after deducting all variable costs from revenue - including COGS, shipping, payment gateway fees, returns, and marketing spend. A healthy CM2 for Indian D2C brands is 15-30% of net revenue. CM2 sets the ceiling for how much you can discount while remaining profitable. The smart approach is to work backward from a CM2 floor to calculate the maximum discount you can afford on each product.
How do product assortment patterns help increase AOV?
Product assortment patterns reveal which products customers buy together, which SKUs drive repeat purchases, and which items act as entry points vs profit drivers. By analyzing purchase basket data, brands can create strategic bundles of complementary products that increase AOV by 25-35%. Small add-on products priced at ₹40-120 near free delivery thresholds also act as effective AOV boosters.
What buying behavior patterns should D2C brands track?
Track three key patterns: (1) Repeat purchase timing - the average gap between orders by category, which reveals when to trigger replenishment reminders. (2) Cart composition changes - how baskets evolve over time, signaling loyalty or churn risk. (3) RFM segmentation (Recency, Frequency, Monetary) to identify Champions, At Risk, and Lost customers for targeted campaigns.
How can D2C brands use data patterns to reduce RTO?
Buying behavior data identifies high-risk orders before they ship. Patterns include: customers who consistently order COD in high-risk pin codes, first-time buyers ordering high-value items, and orders placed during flash sales with abnormal quantities. AI-powered RTO prediction using these patterns reduces return rates by 25-40%.
Sources & References
- Saras Analytics - eCommerce Contribution Margin: How to Calculate, Analyze & Improve (sarasanalytics.com)
- AIMnLaunch - CM2 for Ecommerce: The Only Profitability Metric D2C Founders Should Track (aimnlaunch.com)
- BrandShark - D2C Bundling Strategies to Increase AOV (brandshark.com)
- FireAI - D2C Analytics India: What Top Brands Actually Track (fireai.in)
Related Articles
- D2C Unit Economics India: CAC, LTV, AOV & Contribution Margin
- Increase AOV for D2C Brands in India
- AI Personalization for D2C eCommerce
- Reduce RTO in eCommerce India
- D2C Conversion Rate Optimization
Your data already holds the answers. You just need the right lens.
Insightθ surfaces discount patterns, product affinities, and churn signals automatically from your store data.
See Insightθ in Action or calculate your revenue leaks for free ›