D2C Unit Economics India: CAC, LTV, AOV & Contribution Margin Explained
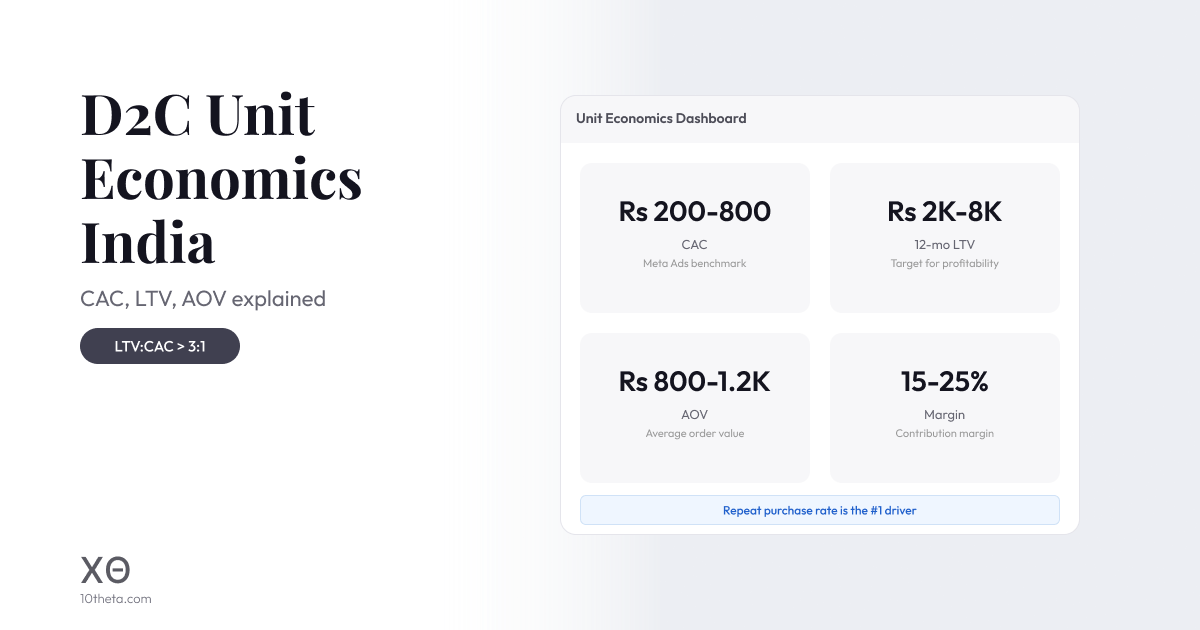
A healthy D2C business needs an LTV:CAC ratio above 3:1 and a payback period under 12 months. For Indian D2C brands, Meta Ads CAC typically runs ₹200-800 depending on category, while 12-month LTV targets range from ₹2,000-8,000 - and repeat purchase rate is the single most important driver.
Every D2C brand that fails has the same root cause: unit economics that don't work. You can have the best product, the most beautiful website, and millions in funding - but if your Customer Acquisition Cost exceeds what each customer is worth, you're paying people to lose money. This guide breaks down the five metrics that determine whether an Indian D2C brand will survive or scale.
CAC: Customer Acquisition Cost
What it is: The total cost to acquire one new customer. Formula: total marketing spend ÷ new customers acquired in that period.
India benchmarks: ₹200-400 for consumables (beauty, food, supplements), ₹400-800 for fashion and apparel, ₹800-1,500 for electronics and furniture. CAC has been rising 30-40% year-over-year due to Meta and Google ad inflation.
How to improve it: Diversify beyond paid ads. WhatsApp referral programs generate customers at 30-50% lower CAC. Content-led SEO has a 6-month payback but near-zero marginal CAC thereafter. Micro-influencer partnerships (10K-50K followers) deliver 3-5x better ROAS than macro-influencers.
LTV: Customer Lifetime Value
What it is: Total revenue a customer generates over their entire relationship. Formula: AOV × purchase frequency × customer lifespan (in months or years).
India benchmarks: ₹2,000-4,000 for single-purchase categories (electronics, furniture), ₹4,000-8,000 for repeat categories (beauty, food, supplements), ₹8,000-20,000+ for high-frequency consumables with strong retention.
The golden ratio: CAC:LTV should be at least 1:3. If you spend ₹500 to acquire a customer, they should generate at least ₹1,500 over their lifetime. Below 1:2 is unsustainable. Above 1:5 means you're under-investing in growth.
How to improve it: Focus on repeat purchase rate (even 5% improvement can double profitability), cross-sell and upsell automation, replenishment reminders for consumables (50-65% reorder rates via WhatsApp), and loyalty programs. Insightθ tracks LTV by cohort and acquisition channel automatically.
AOV: Average Order Value
What it is: Average amount spent per transaction. Formula: total revenue ÷ total orders.
India benchmarks: ₹800-1,200 for beauty/personal care, ₹1,200-2,000 for fashion, ₹1,500-3,000 for health/supplements, ₹3,000-8,000+ for electronics/furniture.
Why ₹100 matters: Every ₹100 increase in AOV compounds across all orders. A brand doing 5,000 orders/month that increases AOV by ₹200 generates ₹10 lakh additional monthly revenue with zero additional CAC.
How to increase it: Smart cart progress bars ("Add ₹299 for free shipping"), AI-powered cross-sell recommendations, bundle offers, and minimum order incentives. Cartθ increases AOV by 15-30% through dynamic cart incentives.
Contribution Margin
What it is: Revenue minus all variable costs per order. Formula: selling price − (COGS + shipping + payment processing + packaging + returns cost).
India benchmarks: 40-50% for fashion (higher COGS, returns), 50-65% for beauty/supplements (lower COGS, fewer returns), 25-40% for electronics (thin margins, high logistics costs).
The profitability test: Contribution margin must cover fixed costs (team, rent, tools) and leave profit. If contribution margin is 50% and fixed costs are 30% of revenue, net margin is 20%. If contribution margin drops to 30%, you're barely breaking even.
How to improve it: Reduce RTO (each RTO costs ₹100-300 in wasted logistics), convert COD to prepaid (eliminates RTO risk), negotiate better shipping rates at volume, optimize packaging costs, and minimize payment gateway fees through smart routing.
Repeat Purchase Rate
What it is: Percentage of customers who buy more than once. Formula: customers with 2+ orders ÷ total customers.
India benchmarks: 15-20% for fashion, 25-35% for beauty, 30-50% for consumables (food, supplements, pet care), 5-10% for electronics/furniture.
The most underrated metric: A 5% improvement in repeat rate can double profitability because repeat customers have zero acquisition cost, higher AOV (they trust the brand), and lower return rates. Yet most D2C brands spend 80% of budget on acquisition and 20% on retention.
How to improve it: WhatsApp replenishment reminders (50-65% reorder rates), post-purchase engagement sequences, loyalty programs with attainable rewards, and personalized product recommendations. Skillθ Agentθ Voiceθ automates all retention workflows.
Putting It All Together
Here's a healthy D2C unit economics model for an Indian beauty brand:
- CAC: ₹350 (blended across Meta ads, influencers, and organic)
- AOV: ₹1,200
- Contribution Margin: 55% = ₹660 per order
- Repeat Rate: 35% → average 2.2 orders per customer
- LTV: ₹1,200 × 2.2 = ₹2,640
- CAC:LTV ratio: 1:7.5 ✅ Healthy
- Payback period: First order (₹660 margin vs ₹350 CAC) → profitable from order 1
Track all these metrics in one dashboard with Insightθ. See your D2C glossary for definitions of all terms used here.
Sources & References
- Inc42 - State of Indian D2C report, unit economics benchmarks and growth metrics for funded D2C startups (https://inc42.com/)
- Bain & Company - India's D2C market analysis, customer acquisition costs across eCommerce categories
- Meta for Business - Average CPM, CPC, and CAC benchmarks for Indian D2C advertising on Facebook and Instagram
Related Articles
- How to Reduce Cart Abandonment for D2C Brands
- How to Reduce RTO in eCommerce India
- COD to Prepaid Conversion Strategies
- 3 Hidden Data Patterns Every D2C Brand Should Track
- How to Increase AOV for D2C Brands in India
Know your numbers. Then fix the leaks.
xθ helps D2C brands improve every unit economic metric - higher AOV, better conversion, lower CAC, and longer LTV.
Get Your Revenue Audit or calculate your revenue leaks for free ›